1. Why do human populations increase or decrease?
https://www.classtools.net/vortex/202002-jSVUYZ
2. How we know what's going on.
|
|
| ||||
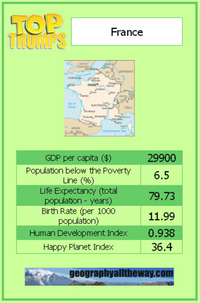
Top Trumps Activity (Thank you to Richard Allaway @ Geographyallaway.com for the amazing resources)
|
Top Trump Rules
Task
| ||||
3. Calculating change
| population_calculation_worksheet.pdf |
3. Human Population Change: Where does HK fit?
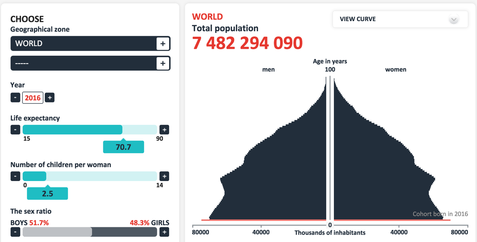
Population Simulation (click the picture for the link)
|
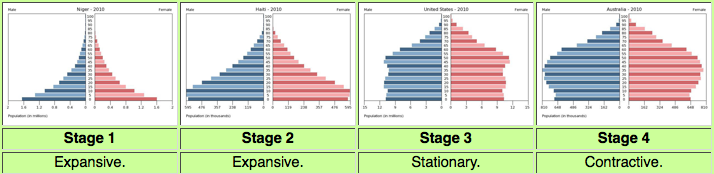
Population structure is the composition of a population. Looking at the population structure of a place shows how the population is divided up between males and females of different age groups.
Population structure is usually shown using a population pyramid. A population pyramid can be drawn up for any area, from a whole continent or country to an individual town, city or village. It is broken down into 4 stages to demonstrate the changing nature of the area. This roughly matches the level of development of an area and can then be used for addressing economic and social policies within a country. |
|
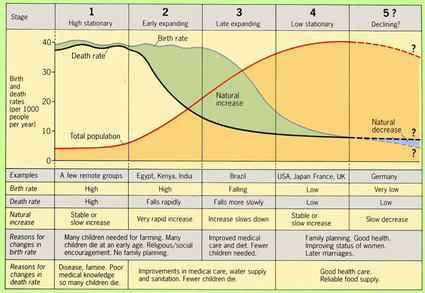
In the early 1800s with an increase in urbanization and improvements in living standards, death rates started declined. New technologies in agriculture and production, and advancements in health and sanitation, meant that a greater number of people survived through to adolescence, increasing the average life expectancy.
Over the past 300 years, population demographics have been a result of the relationship between the birth and death rates within a country, any country. The observation and documentation of this globally, has allowed for the development of the Demographic Transition Model which helps make sense of a population dynamics in any country. Using the Demographic Transition Model, a person can better understand a country’s current population trend based on its placement within one of the five stages of the model and apply that data to be used for addressing economic and social policies within a country.
Over the past 300 years, population demographics have been a result of the relationship between the birth and death rates within a country, any country. The observation and documentation of this globally, has allowed for the development of the Demographic Transition Model which helps make sense of a population dynamics in any country. Using the Demographic Transition Model, a person can better understand a country’s current population trend based on its placement within one of the five stages of the model and apply that data to be used for addressing economic and social policies within a country.
SWF Source: http://www.cengage.com/
